Navexa Live: Roi, Scenarios and your questions
Watch the first Navexa Live with Tom and James: Roi, Scenarios, gold tracking through MCP, cash accounts and answers to your portfolio questions.

Discover the twelve key metrics investors use to assess dividend-paying stocks and the companies behind them.
Investing in dividend stocks is one of the proven, long term methods of building wealth and passive income. Investors can enjoy compounding investment income for many years, and even build enough income that they can live on dividend yields alone.
Researching dividends can be a complex process. So in this post, we’re going to walk through 12 of the key metrics investors can use when analyzing a dividend paying stock or company.
Dividends are a company’s payments to its shareholders. Many investors prefer to hold dividend stocks, since they can collect cash dividend payments, or collect additional shares through dividend reinvestment programs.
There are different types of dividends available to shareholders:
Dividend stocks are sometimes less volatile than growth stocks. This can make them preferable for investors with lower risk tolerances.
Dividends are often paid quarterly, but some companies pay them out annually. A consistent dividend payout might be a sign of a healthy company, but that’s not always the case.
Companies might sometimes offer high dividend yield to entice further investment, when in reality, the business is failing. This is called the dividend trap.
This is why it’s crucial to learn how dividends work, and understand how to analyze the key metrics of dividend-paying stocks.

These types of stocks can deliver returns in two ways:
Additionally, the dividend payouts can compound when they’re reinvested into shares. Stocks can pay dividends despite the share price fluctuating.
Investors can use the money to:
Dividend investing means buying stocks because they pay out regular dividends. Investors seek these stocks by looking for companies that offer stocks with a stable, regular dividend payout.
The usual steps of investing in dividend stocks include:

There are many metrics to follow in dividend investing. These help to build an understanding of how well the company operates, how stable its earnings are, and possible future growth.
The dividend payout ratio is one of the most common financial ratios investors check. It measures how much of a company’s earnings (after tax) is paid out in dividends. It also shows how stable the dividends are and how much the business is growing. High dividend payout ratios tend to be regarded as riskier — since most of the company’s earnings go into dividends, they might not be sustainable.
Dividend payout ratio is calculated by dividing dividends paid by earnings after tax, and multiplying the result by 100.
Investors can see the business’s cash flow from the company statements. Free cash flow shows how much expenditure a company has and how much free cash remains to be given to shareholders through dividends. The better the free cash flow, the more cash is available for dividend payouts.
Free cash flow is calculated using three factors:
Shareholders will usually invest in companies that can grow their capital quickly. Return on invested capital is a similar measurement to return on equity, only it shows a company’s return on both equity and debt.
It’s calculated by dividing the net operating profit after tax by the amount of invested capital.
The company’s operating profits show the earnings before interest and taxes. The operating profit margin is a ratio of income to profits from sales. The higher the ratio, the stronger the dividend income prospects (in theory).
The operating profit margin is calculated by dividing the operating income (earnings) by sales (revenues).
This is a less known financial ratio, but still equally important as others. It measures how many dollars of sales were generated by each dollar of assets. Organizations that have more sales usually generally offer stronger returns.
This metric is calculated by dividing net sales (revenue) by the average total assets.

Sales growth is one of the best metrics to see whether the company has a good business model driving higher revenue. Good sales growth trends show potential for growth.
It’s calculated by first subtracting net sales of the previous period from the current period. Then, the result should be divided by the net sales of the previous period and multiplied by 100 for a percentage.
Businesses also go into debt. This is why net debt-to-capital is crucial for understanding how the organization deals with its finances. Overall, a net debt-to-capital ratio below 50% is considered good.
This metric is calculated by dividing the company’s net debt by its capital.
EBITDA compares a company’s debt to its earnings. It’s often used to compare different businesses. Net debt divided by EBITDA shows how many years the business will take to eliminate debts with cash on hand and annual cash flows.
P/E is another popular calculation to know. It divides a company’s stock price by the earnings per share, revealing to the market how much the company is worth. In general, the P/E ratio of less than 20 is considered good.
TSR helps investors observe both the stock price and dividend yields. It accounts for both the price and the dividends paid. It’s a way to see where a stock sits relative to the wider market.The formula is:
TSR = ( (current price – purchase price) + dividends ) / purchase price
If you want to see how your investments are really performing, you must factor in portfolio income. Navexa makes it easy to see your complete returns for all your stocks and crypto.
Dividend yield represents the percentage of annual dividend payments to shareholders. This number shows what the investor can expect to get in the future from the stocks they hold, if the dividends remain the same. However, the dividend yield can change over time, depending on the market conditions and company developments.
This metric is calculated by dividing cash dividend per share by the current price per share. To get the percentage, multiply the result by 100.
Besides looking into dividend yield, investors also observe the dividend growth rate. This metric shows how much a dividend has increased each year. Those businesses that offer an annual dividend increase could be more appealing.
A steady, long-term increase in dividends shows that the company is (in theory) generating enough cash flow to fund that growth. The formula for dividend growth rate is:
Dividend Growth Rate = (D2/D1) – 1

Investors often look for the best possible dividend payout ratio. Overall, a ratio of 30% to 50% is considered healthy. Payout ratio numbers above 50% may appear unsustainable.
Additionally, the dividend payout ratio varies from industry to industry. For example, you might notice different dividend yields in the tech sector versus among utility companies.
In Australia, investors must pay taxes on both capital gains and dividends.
However, companies pay out dividends that have already been subject to taxation. Australian laws recognize that shareholders shouldn’t be taxed again on the same profits, so investors receive a rebate for the tax that companies have paid. These dividends are known as “franked”. They also have a tax credit.
On the other hand, ‘unfranked’ dividends don’t have a tax credit, as the company didn’t pay taxes for them, so investors will have to.
The financial year in Australia goes from July 1 to June 30. This is the period when shareholders should collect all the financial information and go through an assessment.
In Australia, dividend reinvestments are treated the same as cash dividends. This means that if you receive shares instead of cash, you’ll still need to pay taxes.
If you struggle to calculate portfolio gains for the fiscal year, Navexa is here to help. Once you upload your portfolio, Navexa’s taxable income reporting tool automatically calculates your obligations and provides a detailed breakdown for reporting purposes.
What’s more, you can download this data in XLS or PDF and easily report your capital and other gains.

Dividend strategy refers to planning around when to buy and sell shares in a dividend-paying stock. The dividend capture strategy is one of the common ways investors get into dividend stocks.
To do this, investors keep track of the dividend timeline:
In this strategy, the best moment to purchase the stock is right before the ex-dividend date. Then, investors would receive the dividends, and sell the shares right after they’re paid. The main purpose of buying and selling is to get the dividend, then exit the position.
This is the opposite of long-term investing, where the investor keeps the stocks and allows for compound growth.
Dividend analysis is when investors to analyze dividend-paying stocks over a long period. The data is presented in graphs and shareholders can easily see if the company pays regular dividends per share, and if it increases them. Dividend analysis also shows how sustainable dividend payouts are for the company based on current earnings.
Many investors get into dividend stocks to boost their passive income through dividend yield. Still, there are some pros and cons to consider when it comes to investing in dividends.
Pros:
Cons:

Investing in dividend stocks can be a solid strategy — or part of a strategy — for building long-term wealth in the stock market. However, experienced dividend investors know there’s more to it than just picking out the first company they come across.
The dividend payout ratio is one of the most important metrics to consider. The other 11 metrics we’ve detailed here are also important in analyzing a dividend stock. These key metrics can help to analyze not just the stock price, dividend yield, or payout ratios.
They also tell a story about how the company operates and whether purchasing a specific stock could provide a long-term dividend yield or perhaps indicate a dividend trap.
Keep in mind that dividend investing carries both risk and tax obligations. This is where Navexa can help.
We’ve built a powerful automated tracking tool that allows you to track all your stock and crypto performance in one place. Navexa tracks and records all dividend income and calculates its impact on your total performance.
At tax time, our Australian customers can run automatic reports to calculate and optimize both their CGT and taxable income activity.
Sign up for free today and test out Navexa’s powerful automated investment performance tracking and tax reporting tools.
Track your portfolio in Navexa
Free 14-day trial. No credit card required.
Try Navexa Free →Watch the first Navexa Live with Tom and James: Roi, Scenarios, gold tracking through MCP, cash accounts and answers to your portfolio questions.
Join Tom and James for weekly Navexa demos and Q&A. Our first 40-minute session is on 28 October at 1 pm AEDT. Register, submit a question and receive the recording.
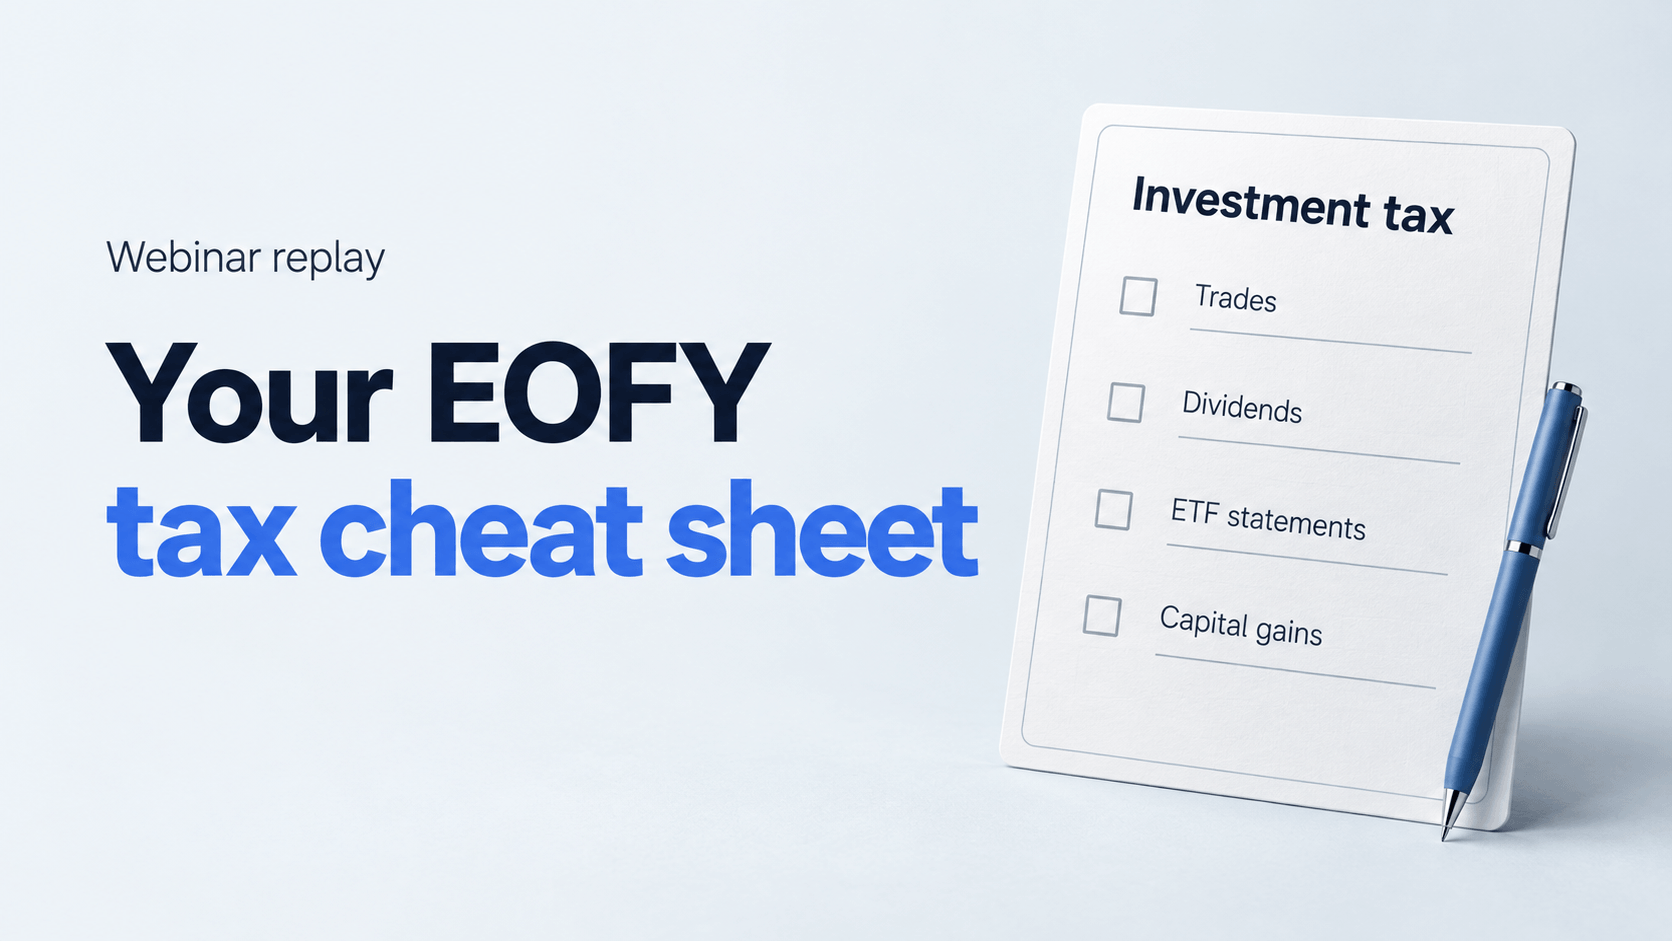
Watch my Marcus Today webinar on investment tax records, AMMA statements, cost base adjustments and parcel selection, with slides and audience questions.