Four ETFs, more than 1,000 companies. How much was riding on five?
Four ETFs held more than 1,000 companies, yet five accounted for 19.4% of the money. Navarre Trousselot traces the overlap and shows you how to find your own top ten.

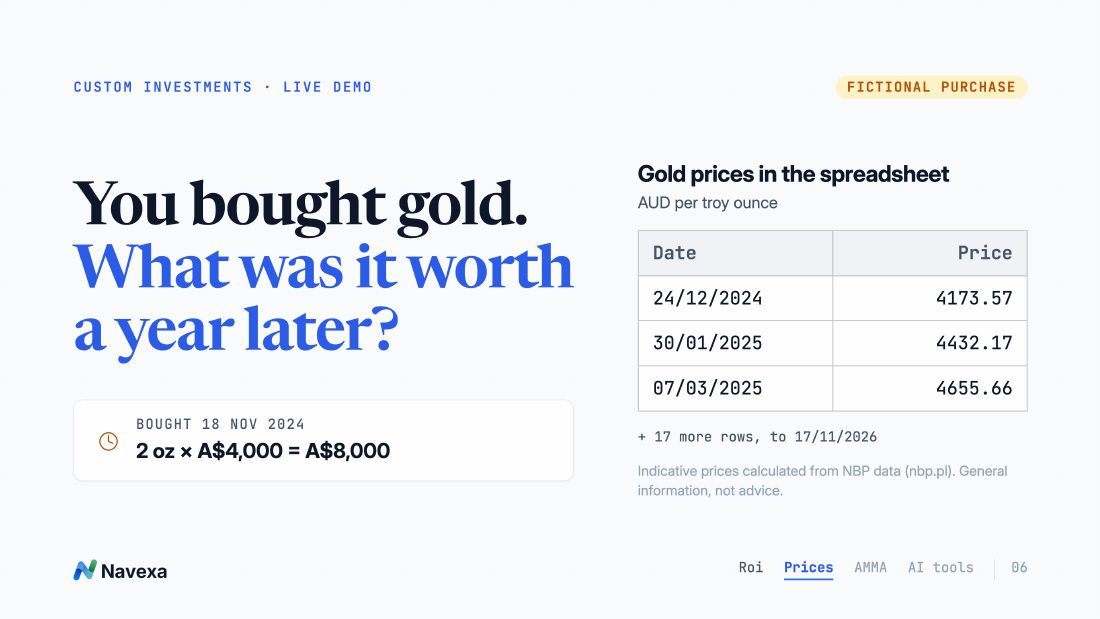
If you’ve been tracking an investment with no live price feed, you can now bring its price history into Navexa in one file. James and I tested that with a fictional gold holding on 18 November. We also uploaded a sample AMMA statement to Roi, asked it which holdings drove our demo portfolio’s returns, and used Claude to compare the portfolio with a benchmark.
See the custom price upload, the AMMA statement demo, and what we asked Roi and Claude.
Open on YouTube ↗Recorded 18 November 2026. Use the chapter links below to jump to a topic.
Our gold holding started with a flat chart because we’d only recorded its first price. After importing the dated prices, we could see how its recorded value changed over time. The same workflow applies to other Custom Investments without a live price feed, such as property, private shares and unlisted funds.
The import updates the holding’s price history. The full steps are in the custom price import guide.
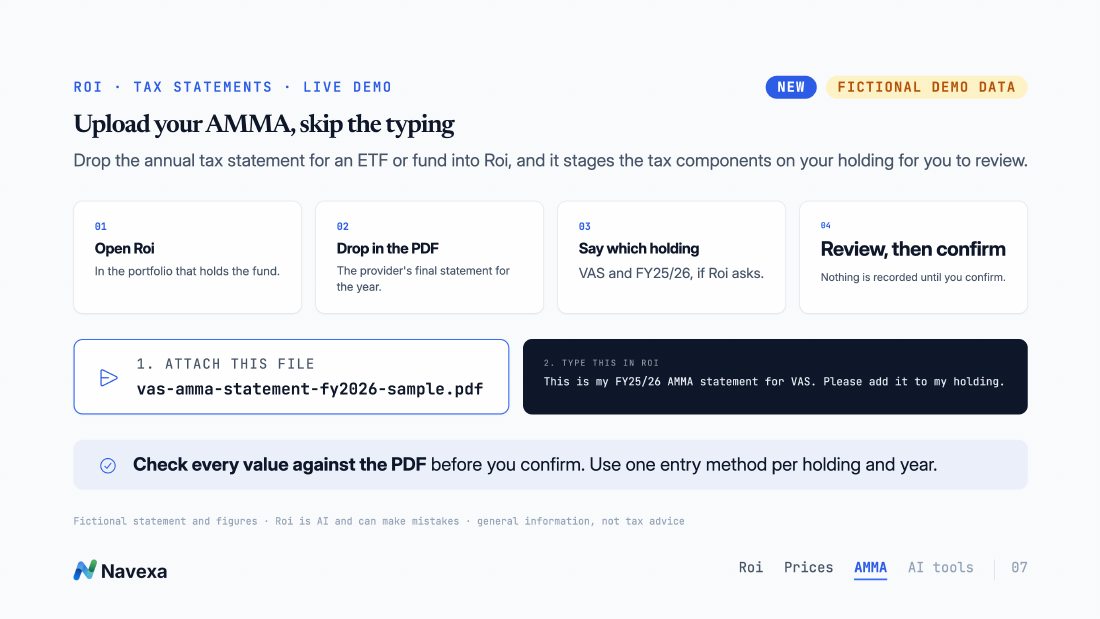
An AMMA statement is the annual tax statement an Attribution Managed Investment Trust sends its members. For the demo we attached a fictional FY2025–26 statement for VAS in Roi and specified the holding and financial year. Roi presented the extracted components for review. After confirming the update, we reopened the holding’s Income page to check the statement on the right holding.
We then asked Roi to explain the figures, including the cost-base adjustment. It picked up an earlier year when we started a fresh chat, so we put the financial year back into the question. Check the holding, year and each extracted figure against the fund’s final PDF before approving a change. Use one entry method per holding and financial year.
You can also enter the values manually or import the PDF through the holding’s Income page or the Taxable Income report. See how to enter or import an AMIT/AMMA statement.
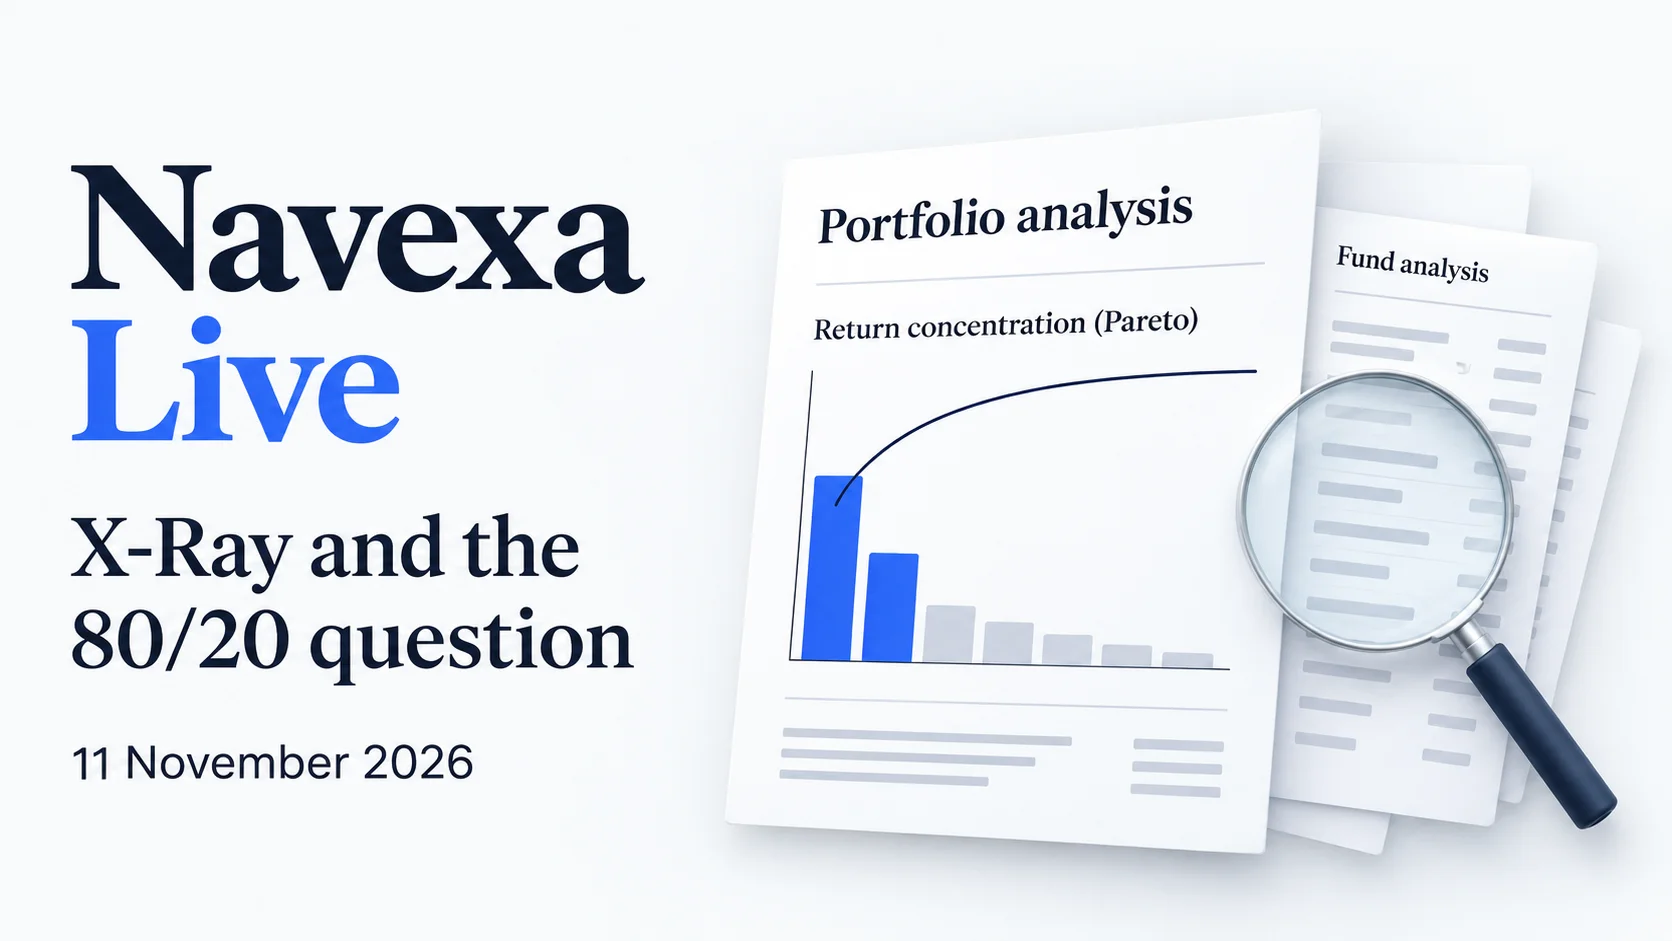
Last week James ran a Pareto analysis through Claude. This week we put the same question to Roi in Navexa and got a head-and-tail chart. The chart shows each holding’s contribution to the portfolio’s overall return. A few positive contributors can account for more than 100% of the net return when losses elsewhere bring the total down. The 80/20 split is a question to explore, and the answer depends on the portfolio and period.
James connected Claude to Navexa and compared weekly returns for our demo portfolio with VOO, an ETF that tracks the S&P 500. Beta measures how sensitive the portfolio’s returns were to moves in that benchmark in the model. R² describes how much of the variation in weekly portfolio returns the model accounted for. In our example, beta was 1.90 and R² was 0.33, so the benchmark accounted for about a third of the weekly variation.
Alpha was the estimated return left after accounting for the cash rate and benchmark in the model. Its estimated range included zero, and leaving out three large weeks changed the result substantially. Check the period, currency, benchmark and which holdings are included when reading the output. The demo used 53 weekly observations in AUD and excluded VAS and VOO from the demo portfolio for that comparison.
To try the workflow, follow the guide to connect Navexa to Claude or ChatGPT. Review the data and tools you approve, and check any AI-generated calculations against the underlying records.
Yes. If the underlying holdings are missing, check the report date and fund coverage first. You can then request the fund through Navexa Feedback with its name, ticker and exchange. The X-Ray coverage guide explains what to look for. James also confirmed that X-Ray can use a Portfolio View to combine exposures across included portfolios.
No. VOO was the benchmark James picked for this example. The same type of comparison can use a different benchmark, and the choice changes what the result tells you. The regression compares historical weekly returns over a set period.
All 16 slides from 18 November, with the price import steps, prompts and benchmark charts.




James and I will be back on Wednesday 25 November at 2 pm Melbourne time (AEDT). Bring your Navexa questions, or send one in advance when you register.
Examples use fictional portfolio records. This session provides general information only. For advice about your circumstances, speak to a licensed adviser or a registered tax agent.
Track your portfolio in Navexa
Free 14-day trial. No credit card required.
Try Navexa Free →Four ETFs held more than 1,000 companies, yet five accounted for 19.4% of the money. Navarre Trousselot traces the overlap and shows you how to find your own top ten.
Watch the 11 November Navexa Live replay: Portfolio X-Ray, Roi prompts, the updated app and James’s 80/20 portfolio example, with slides and audience questions.
Watch the 4 November Navexa Live replay: a Portfolio X-Ray preview, reusable Roi skills, James’s Claude example and answers about dividends, DRP and share registries.