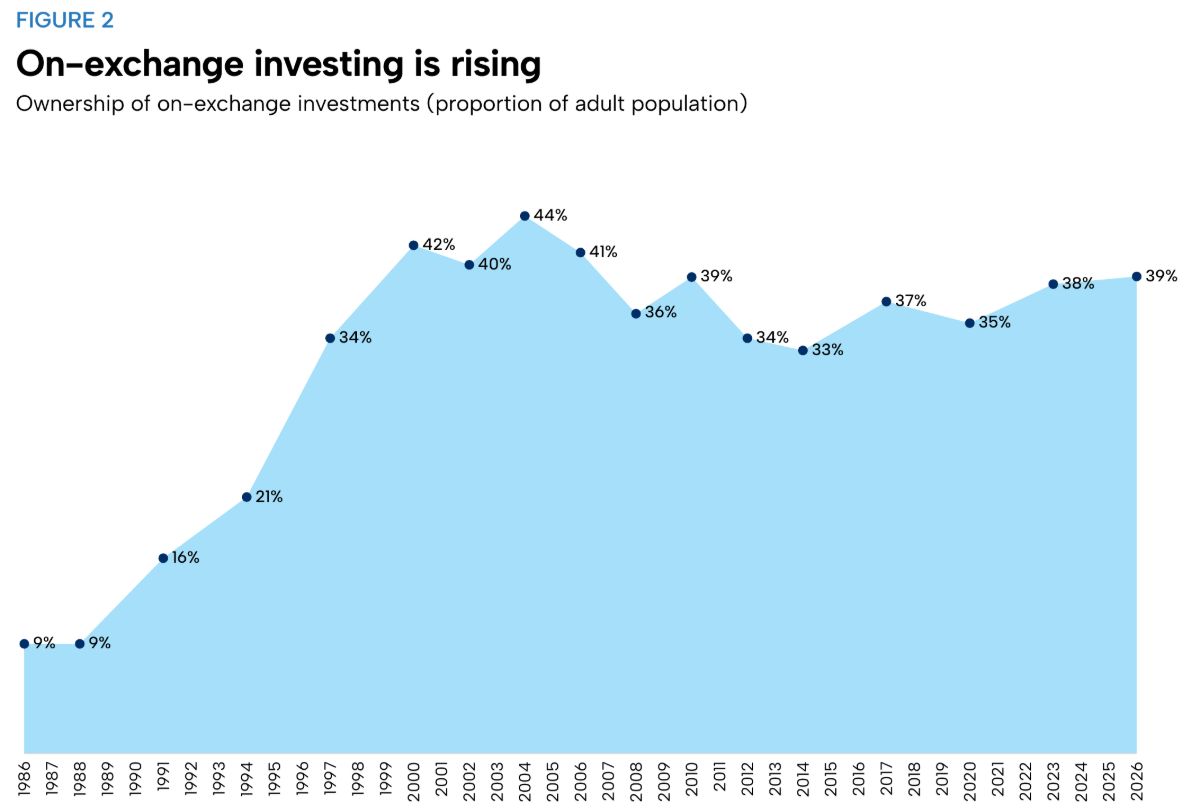
What 40 Years of ASX Surveys Reveal About Australian Investors in a Crash
In 1986, Australia's stock exchanges ran the first edition of a survey called the Australian Share Ownership Study. It found that about a million Australians…
I’ve been fortunate to meet people from right across the wealth spectrum.
I had a friend who spent a significant period of his life living in a van, for instance — technically living under a roof, but also technically homeless.
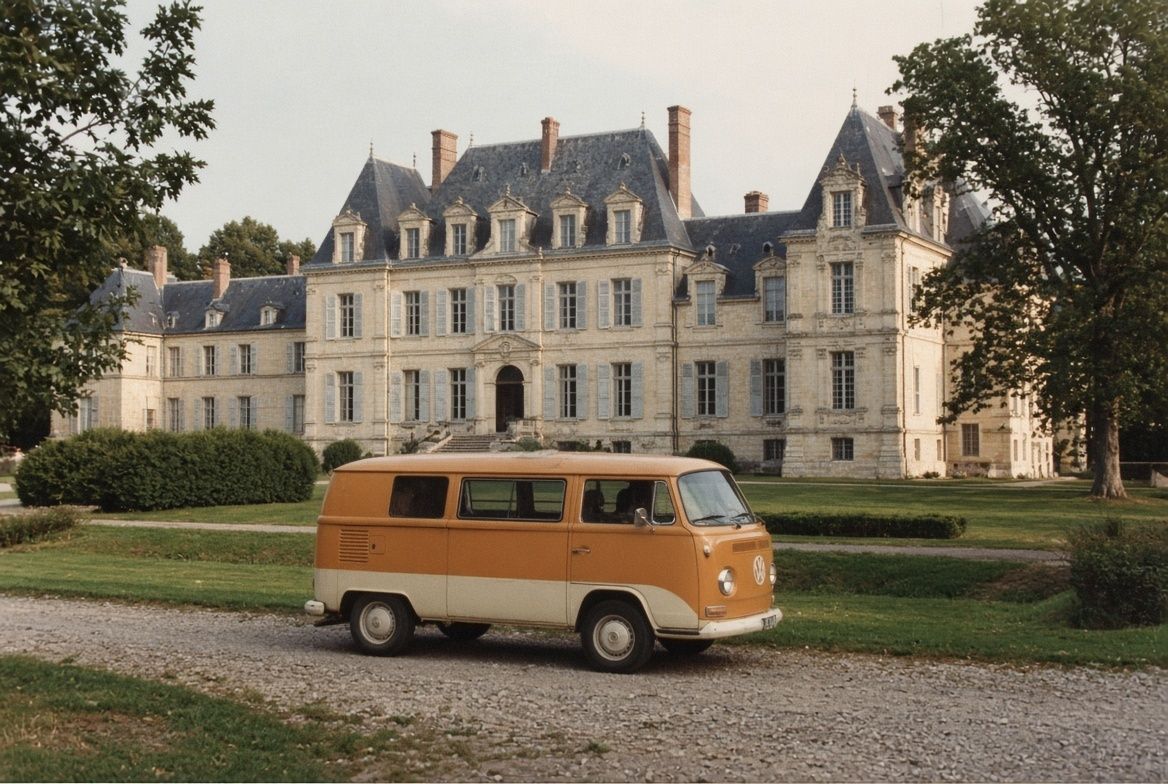
At the other end of the spectrum, I once dined on a lavish French estate with an entrepreneur who likely ranks inside the 10,000 wealthiest people on the planet.
The French estate, of course, was his — one piece of a vast luxury property portfolio spanning Europe and the Americas.
Since I started working in the financial world, I’ve met a great many people in between these extremes.
Over the years, patterns emerge.
Each person has their own appetites for risk and reward, their own limiting beliefs around returns and wealth, their own sense of what you might call their ‘lane’ and the guardrails separating it from other travelers on the investing superhighway.
If I were to rank these investors into groups, it would be tempting to start with net worth or portfolio size cohorts.
But that doesn’t tell you anything other than who has the most money.
What’s more interesting is the behaviors, strategies and mindsets unique to people across the financial spectrum.
So this Benchmark is not the usual economic history piece.
This week, we’re ranking investors on a five-rung ladder to examine what changes as wealth builds and experience compounds.
Most wealth ladders rank people by net worth. One hundred thousand. One million. Ten million, and so on.
They're easy to build and easy to read. Your balance tells you your level. If you want to rank higher, it’s easy; get more money.
You’ve probably met at least one person in your time who had, or seemed to have, plenty of money, yet behaved like a gambler rather than an investor.
And you’ve probably met their opposite; someone of apparently modest means who you’d never know has money, but who is quietly building their wealth in private.
But net worth is an output. Behavior is an input. So are strategy, patience and risk-taking.
Income, starting capital and luck all shape the number. The part you control is how you invest, and over decades that part compounds.
This is why when we built Navexa we focused more on the annualized performance calculation than simply the total return or balance of a portfolio.
A ladder built on behavior tells you something a net-worth ladder can't. Some people run a $5 million portfolio like a casino. Others run a $50,000 portfolio like an endowment.
This ladder measures how efficiently each investor uses the capital they have.
Capital efficiency, in this sense, means keeping and compounding as much of every dollar as possible, after costs, tax, mistakes and time.

The Speculator is optimizing for excitement, even if they don’t know it yet.
The horizon is days to weeks. Trades come from tips, headlines, a group chat, whatever is moving on the screen. They open positions quickly and close them quickly, often for the same reason.
The Speculator doesn't know whether they're winning or losing. They’re running on hype, emotion and hits of dopamine.
They remember the wins. They explain away the losses. There is no benchmarking, no tax awareness, no long-term vision or ruleset.
The step up is a plan: deciding, before the next trade, what you're trying to achieve and how you'll know whether it's working.
If they mature, the Speculator evolves into the Trader.
The Trader has a plan. It's usually a plan to beat the market this month or this week.
Their trades are more considered than the Speculator’s.
There's research, conviction, a watchlist, perhaps a spreadsheet. Turnover is high, but each trade feels justified on its own terms.
This is the most deceptive rung on the ladder, because it feels like sophistication.
The appropriate meme here is something like this:

In 2000, economists Brad Barber and Terrance Odean published a study of 66,465 American households with accounts at a discount broker between 1991 and 1996.
The average household turned over 75% of its portfolio every year.
The households that traded most earned 11.4% a year.
The market returned 17.9%.
The detail that matters is what happened before costs. The frequent traders' picks performed about as well as everyone else's. The gap came from what it cost to keep acting on them.
Barber and Odean gave the paper a title that leaves little room for interpretation: Trading Is Hazardous to Your Wealth.
Brokerage is far cheaper today than it was in the 1990s. Spreads, tax on short-term gains and the cost of a badly timed decision are still with us.
The Trader's blind spot is net return. They count wins on a per trade basis. They count costs once per year, if at all.
The step up is to measure the whole portfolio, after everything, against a benchmark.
The Accumulator has discovered the power of doing less.
The horizon is years (you’ve noticed the time horizon trend by now, I imagine).
They buy quality, or buy the index, and hold. They probably trade when new money arrives. Their portfolio grows quietly in the background of their life.
This is often where investors find, to their surprise, that they've overtaken friends who seemed far more engaged with markets.
The best-known Accumulator of all might be Ronald Read.
Read pumped gas in Brattleboro, Vermont, then worked for 17 years as a part-time janitor at a J.C. Penney store. He drove a second-hand car and held his coat together with safety pins.
When he died in 2014, aged 92, his lawyer found a five-inch stack of share certificates in his safe deposit box. More than 95 stocks, mostly blue-chip dividend payers. He'd held many of them for decades, reinvesting the dividends along the way.
The estate was worth almost $8 million. He left $4.8 million to the local hospital and $1.2 million to the town library.

Read rarely sold. He just kept buying, for more than half a century.
He's also a neat illustration of where this rung tops out. His fortune sat as a pile of paper in a bank vault, and nobody knew what it was worth until someone added it up after his death.
And this is the Accumulator's blind spot: patience and efficiency are different things.
They know their portfolio is growing. But they often don't know by how much after tax and fees, or how that compares with a simple benchmark. Allocations drift. Old positions sit unexamined, because selling would mean thinking about capital gains.
The step up is to judge the portfolio the way a professional would: total return, after costs and tax, against a benchmark.
The Allocator thinks about the portfolio before the individual investments inside.
There's a target allocation, and a reason for it. Rebalancing happens on a schedule, or when the mix drifts past a threshold, rather than when the news gets loud.
Costs and tax are part of every decision. The Allocator weighs each sale against the tax it triggers and the holding-period rules that apply. For Australian investors, those rules change from 1 July 2027, when cost-base indexation and a 30% minimum tax replace the 50% CGT discount for gains accruing after that date.
Norway's sovereign wealth fund is a textbook Allocator.
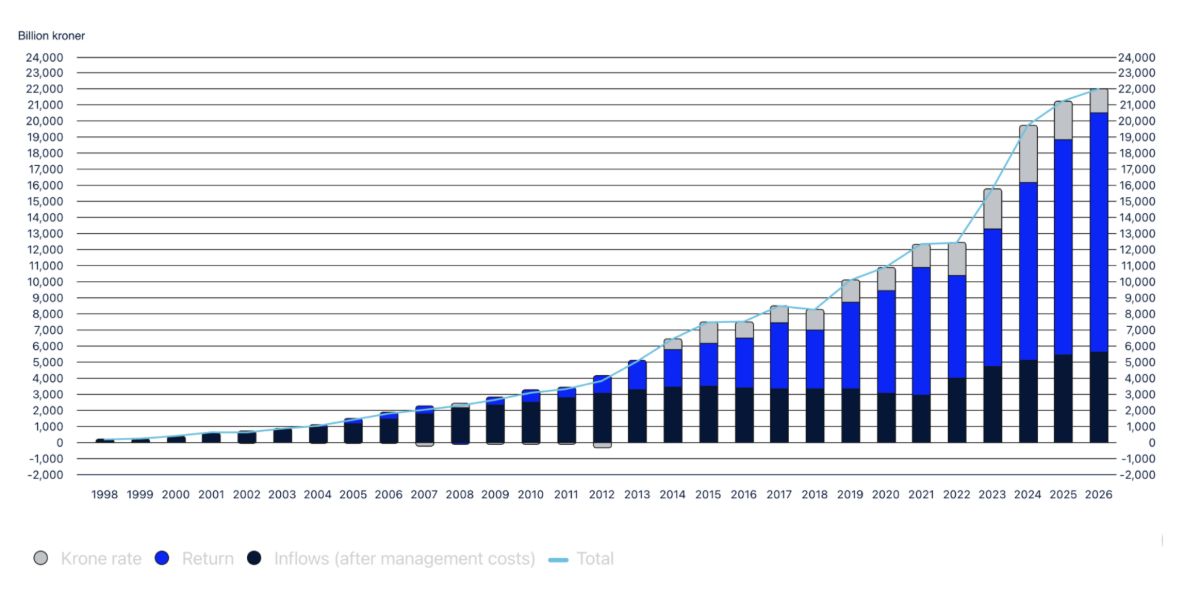
In 2008, the fund was partway through lifting its share of equities from 40% toward a target of 60%. Then the global financial crisis hit.
Its rules called for rebalancing: sell the bonds that had held their value, and buy the shares everyone else was dumping.
So that's what it did. Yngve Slyngstad, who ran the fund at the time, later said they bought $175 billion of equities, about 0.5% of the market, in the middle of the crisis.
The fund lost 23.3% that year, its worst result to that point. But it was well positioned for the decade-long bull market that followed.
Norway, of course, has one portfolio and one mandate. Most private Allocators are juggling several.
But even the Allocator has a blind spot. Often, they optimize each decision in isolation.
The step up is to look at the whole picture, every account and every structure across the years ahead, before acting.
The Capital-Efficient Investor trades rarely, and almost never by accident.
Before they make a move, they model the potential consequences: the tax, the costs, and how the change affects the whole portfolio and every structure or entity that portfolio impacts.
They are optimizing for long-term performance. Like decades long, if not multi-generational.
They measure performance after tax and fees, against a benchmark. So they know whether their decisions are adding value or merely adding activity.
From the outside, it looks almost idle. Warren Buffett once described Berkshire Hathaway's investment style as ‘lethargy bordering on sloth’.
Their idleness comes from the work they do beforehand, and their deep understanding of the most powerful force in investing: time itself.
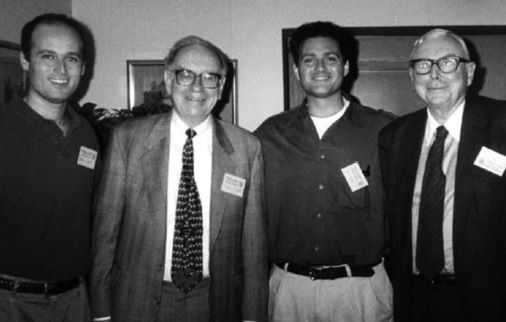
Buffett laid out the arithmetic in his 1989 letter to Berkshire shareholders.
Imagine, he wrote, $1 invested in something that doubles every year. Sell it at the end of each year, pay 34% tax on the gain, reinvest what's left, and repeat for 20 years. You end up with about $25,250.
Now imagine a single investment that doubles every year for 20 years, and you sell it only once, at the end. After the same 34% tax, you're left with about $692,000.
Same returns. Same tax rate. Roughly 27 times the outcome.
The only difference, Buffett explained, was the timing of the tax payments. He likened Berkshire's unpaid tax on unrealized gains to an interest-free loan from the US Treasury, due only when Berkshire chose to sell.
The priority has moved from the next trade, past the next year, to the next decade.
Look back down the ladder and some crucial things change at every step.
Trading frequency falls. The time horizon lengthens. The question shifts from ‘what should I buy or sell now?’ to ‘what does this do to the big picture in the long term?’.
None of it depends on wealth. Plenty of very rich investors spend decades as Traders. A high income or a good business carries them while costs and tax quietly eat into their returns. By the same measure, plenty of investors with modest portfolios already behave like Capital-Efficient Investors.
The levels aren't fixed, either. A market crash can drag an investor back, for example.
Like the markets themselves, an investor’s progress up the rungs is seldom linear.
Climbing usually means fewer actions and more thought.
This week's quote:
‘There is nothing stronger than those two: patience and time, they will do it all.’
— General Kutuzov, in Leo Tolstoy's War and Peace
Invest in knowledge,
Thom
The Benchmark
Read more: What 40 Years of ASX Surveys Reveal About Australian Investors in a Crash
Enjoyed? Forward this edition to a future subscriber (or subscribe yourself).
Get the next issue
The Benchmark lands free in your inbox every Thursday.
In 1986, Australia's stock exchanges ran the first edition of a survey called the Australian Share Ownership Study. It found that about a million Australians…
On October 7, China's central bank published one of the dullest documents in finance: its monthly reserve statement.
The ticket inspector flashed his identification. I opened the app containing my valid ticket, only to find that my valid ticket had not transferred over to my…