
A tale of two investors
On a cold Monday morning in January 2000, two investors sat down at their kitchen tables.
They each had $100,000 to invest.
They had much in common.
Both were 45.
Both had spent twenty years in steady jobs, saving more than they spent each year.
Both read the financial news, distrusted gurus, and had a long-term outlook for their investments.
But that January morning, their paths diverged.
Investor A lent his money to the government.
He put it into 10-year Treasury notes — loans to the government that pay a fixed rate of interest every year for 10 years, and then hand your money back.
His investment paid about 6.7% a year, which he reinvested automatically.
Investor B bought the stock market instead.
His $100K went into an S&P 500 index fund. He, too, reinvested his dividends.
Ten years later, these two investors were in very different positions.
Investor A’s $100,000 had grown to roughly $180,000.
But investor B only had about $91,000.
The scorecard:

So what made the difference?
It wasn't intelligence.
It wasn't discipline either. Both men were equally patient.
Something else is responsible for the huge delta between our two investors.
And that something is what this week’s Benchmark is about.
The price of risk
Investor A lent to the government and collected a fixed rate of interest. Stable, predictable.
Investor B invested in stocks in the hope that they’d outperform fixed income returns. Less stable, but more potential upside.
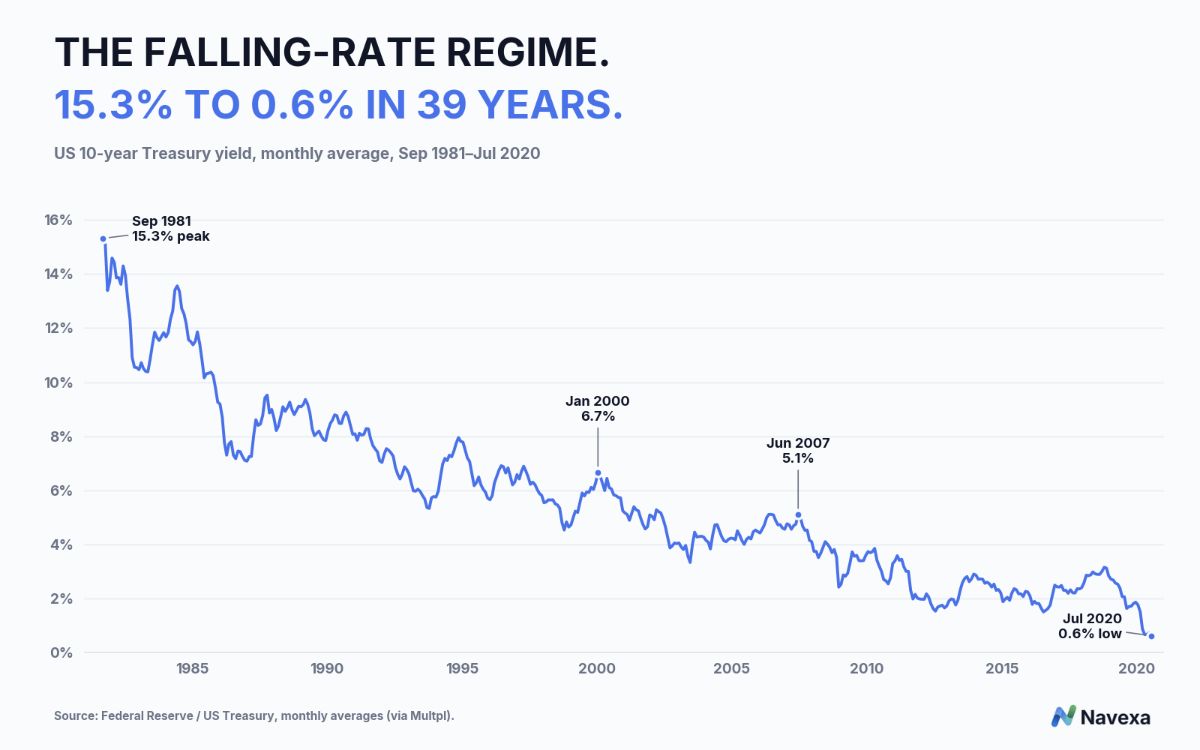
Investor A's 6.7% in January 2000 looked like a good deal.
But it was actually significantly lower than what he could have earned had he bought his bonds earlier.
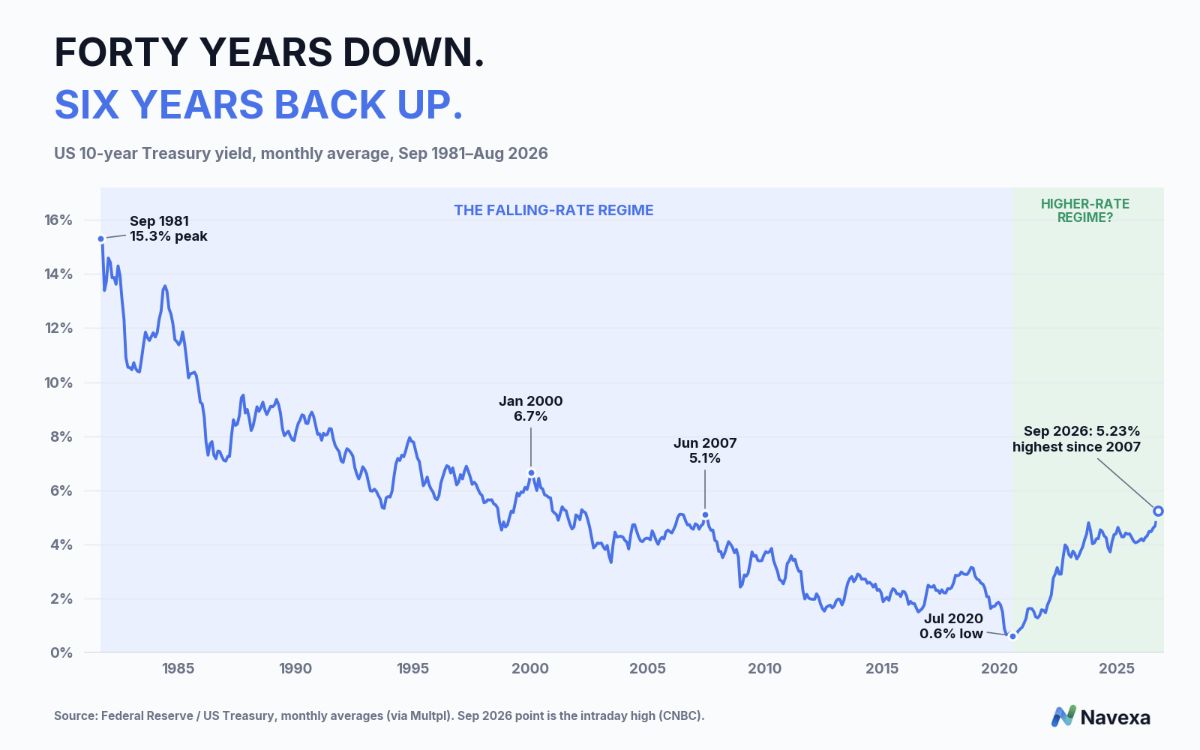
The 10-year US Treasury yield peaked in 1981 at an all-time high of 15.3%.
This meant an investor could collect more than $15,000 a year on a $100,000 investment — more than $1,250 a month.
From there, it fell for almost 40 years. Call it the falling-rate regime.
So why did Investor A choose bonds?
You have to look at what each option was offering him that January morning.
The Treasury note paid 6.7%, guaranteed by the US government, for 10 years.
Inflation was running at 2.7%. So even after inflation, he was locking in almost 4% a year, no risk.
But the stock market was a different story as 2000 began.
The dot-com boom had pushed share prices so high that the S&P 500 traded at 29 times its companies' annual profits.
So every $100 invested in the index bought about $3.44 of yearly earnings.
Whereas the bond paid almost double that.
By a longer measure — Yale economist Robert Shiller's cyclically adjusted P/E ratio, which compares prices with ten years of average profits — stocks had never been more expensive.
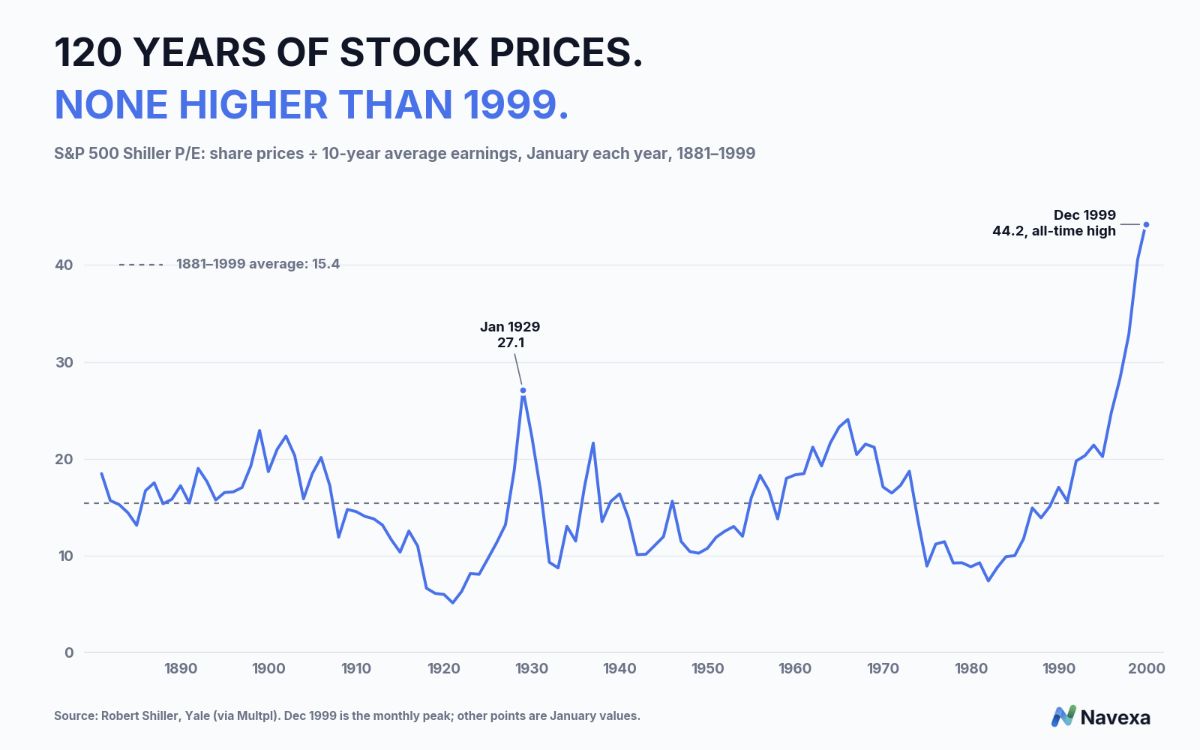
The ratio peaked at 44.2 in December 1999, a record that still stands.
So investor A wasn't being timid, necessarily. He was being offered almost twice the return, with none of the risk.
What he couldn't know was that rates would keep falling for another twenty years.
His notes would hold up just fine, but every time one matured, he'd be reinvesting at a lower rate (hence his annualized return being lower than the yield on his initial investment).
Investor B simply bought the most expensive stock market in history, and had the not-great fortune to get wrecked by two massive crashes in a decade.
But what happens if these two investors start in 2007, instead of 2000?
Round two: 2007
In June 2007, right before the global financial crisis, our two investors start again with $100,000 each.
The 10-year pays about 5.1%. Investor A locks it in.
Investor B buys the S&P 500.
Within two years, his portfolio has lost more than half its value.
But as in the first race, both men hold on, reinvesting their investment income.
Then the Federal Reserve steps in. To stop the financial system collapsing, it cuts interest rates to almost zero in December 2008 and holds them there for seven years. Bond yields fall.
With safe assets paying next to nothing, money goes looking for a return elsewhere, and much of it flows back into the stock market.
By June 2017, Investor B's $100,000 is worth roughly $199,000. Investor A, on the other hand, has about $157,000.
The scorecard this time:
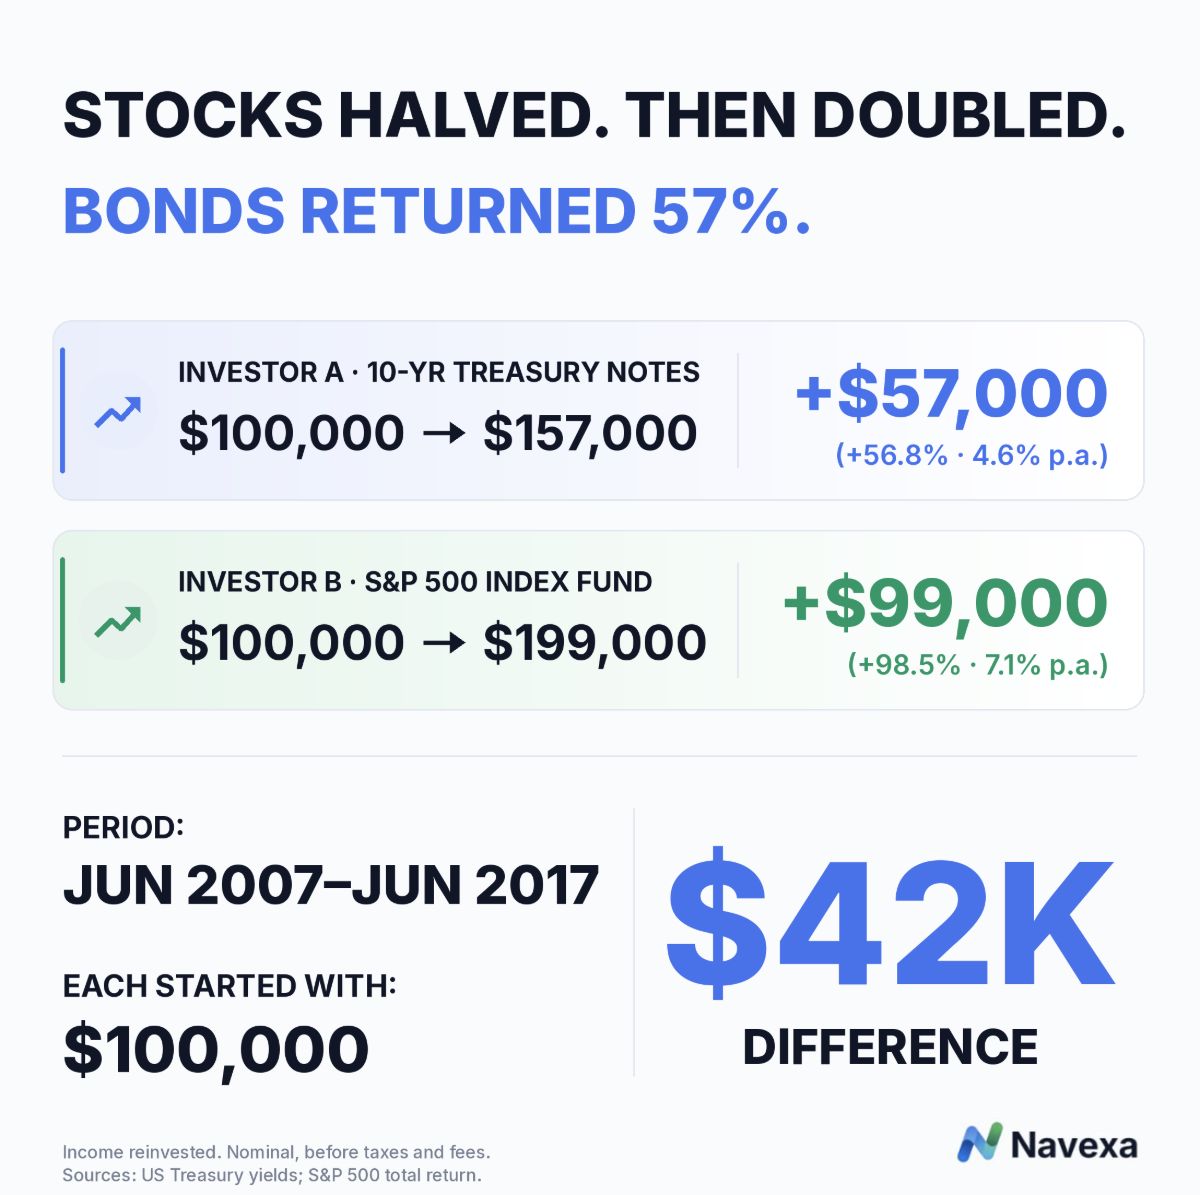
Investor B wins the second race. But look at what he went through, and at what saved him.
Both races ran inside the falling-rate regime.
In the 2000 race, falling rates couldn't make up for buying at the top of a bubble.
But in the 2007 race, they arrived just in time.
In both cases, bonds paid between 5.1% and 6.7% at the start.
Stocks delivered one lost decade and one 99% return (via a generational crash).
Dawn of the next high-rate era?
Around 2020, the 40-year interest rate decline ended.
It ended with inflation.
As the world reopened after the pandemic, prices rose faster than they had in four decades, and US inflation peaked at 9.1% in June 2022.
The Federal Reserve responded by lifting interest rates from almost zero to above 5% in little more than a year, the fastest rise since the early 1980s.
Bond yields followed. The 10-year, which had paid 0.6% in the summer of 2020, was back above 4% by late 2022.
For a while, it looked as though things might settle there. But they haven't.
This year, war in the Middle East has pushed oil back above $100 a barrel, and inflation is back up with it.
Just this month, the Fed raised rates for the first time in three years.
Washington keeps borrowing heavily to fund its deficits, and technology companies are issuing huge amounts of debt to pay for the AI buildout.
Since buying a bond is lending money, when there are more bonds for sale than lenders who want them, borrowers have to offer a higher interest rate to compete.
Last week, the yield on the 10-year US Treasury briefly reached 5.23%, the highest since June 2007.
The average 30-year fixed US mortgage jumped to 7.45%, its highest in more than two years.
Zoom out, and the last six years start to look more like the reversal of a 40-year trend, and the beginning of a new regime:
Regime change
Investors have traditionally expected stocks to earn a few percentage points a year more than government bonds.
That extra return is the reward for sitting through crashes like 2008.
Economists call it the equity risk premium.
One rough way to measure it is to compare the stock market's earnings yield (a year of company profits divided by the share price) with the 10-year Treasury yield.
Today, the S&P 500 trades at about 26 times its companies' annual profits, which puts its earnings yield at about 3.8%.
The 10-year US Treasury now pays 5.2%.
On that measure, the traditionally safe option pays more than the stock market.
It's a crude comparison, since company profits can grow and a bond's interest can't. But it shows how far the balance has shifted.
The 2000 and 2007 races started from similar conditions.
In 2000, a 6.7% bond was enough. Stocks were so expensive that Investor A finished $89,000 ahead.
In 2007, 5.1% wasn't, because the Federal Reserve cut rates to almost zero and kept them there for seven years. That rescue is the real reason Investor B came out $42,000 in front.
Today, the safe option pays more than 5% again, just as it did in 2000 and 2007.
But stocks are priced much closer to 2000 than 2007.
Shiller's P/E stands at 41 today. In June 2007, it was 27. In December 1999, it hit its record of 44.
Which brings us back to the question we started with.
Two men. Same age, same savings, same patience. Twice, they made exactly the same choices. Twice, they got opposite results.
Very little of what they did explains the difference.
What explains it is the backdrop they were investing against. Interest rates set what the safe option paid, how much investors would pay for stocks, and whether a crash got repaired.
For 40 years, rates moved in one direction. Almost everything most investors know about markets was learned with that wind at their backs.
Arguably, that wind mattered more than any decision either man made.
Most investors alive today have never invested without it.
This week's quote:
'The winds and waves are always on the side of the ablest navigators.'
— Edward Gibbon,
The History of the Decline and Fall of the Roman Empire
Invest in knowledge,
Thom
The Benchmark
Read more: The 500-year-old AI oligopoly playbook
Enjoyed? Forward this edition to a future subscriber (or subscribe yourself).
Connect: I post every day on LinkedIn
Enjoyed this issue?
Subscribe to The Benchmark
Weekly insights on markets, investing, and portfolio strategy.