All data in this report is analysed over the window 1 February – 30 June 2026. The week since the cut-off has seen major market activity — which will make for an exciting second edition of our analysis.
Hand 2,205 people $100,000 of paper money and a simple brief: pick up to ten stocks, ASX or global, lock them in for the year, and see who's standing at the finish. That was Stock Genius, and as of 30 June 2026 we're roughly halfway.
Six months in, the leaderboard has been blunt about what it rewards, and clever stock-picking sits surprisingly far down the list. So does calling the oil war, and timing the AI melt-up.
One decision, made back in February, has mattered more than everything else put together: which market you bought. The players who looked past the home ground and bought America are the ones in front.
Here's the year so far, told through the 1,898 players who put their money to work: ten stocks, a hundred grand. Every return you'll see is capital gain since 1 Feb, so everyone starts level at zero.
For all the talk, the field is quietly underwater: just 48% are in the green. With the market itself barely moving, most portfolios finished a shade the wrong side of flat.
The averages hide it. One monster portfolio, up +231%, drags the mean up toward flat. Strip it out and the median tells the truth: −0.7%, a touch in the red.
The story so far
It wasn't stock-picking. It was geography.
One chart explains the year. Take every holding in the game, split it by where it's listed, and index each market from 1 Feb. One game, six months, three completely different lines. America ran away from home.
Fig. 1. Value-weighted total return of holdings since 1 Feb, by listing market — US-listed, ASX, and other.
Same war. Same rate hikes. Same headlines. Two ways to spend the identical $100k, and a chasm between them.
And the money leaned home. The field put the bulk of it into the local market, and kept America to a smaller slice.
| Listing market | % of capital | Invested | Worth 30 June | Holders | Return on cost |
|---|---|---|---|---|---|
| Australia | 69.5% | $111.2M | $103.6M | 1,756 | -6.8% |
| United States | 30.4% | $48.7M | $78.1M | 1,422 | +60.6% |
| Other | 0.1% | $0.2M | $0.1M | 11 | -6.5% |
Look at the last column. Every dollar sent to America grew; the money kept at home slipped. The bigger bet sat on the market that lagged.
And this was the most decisive cut in the whole game, sharper than deployment, diversification or anything else we can slice by. Sort every player by how much of their stake crossed the Pacific, and watch the median climb almost perfectly with it:
Fig. 2. Median portfolio total return since 1 Feb, by share of capital held in US-listed names.
A near-perfect staircase, bottom step to top. The more of a portfolio that sat in US-listed names, the better it did.
Why America won: an AI story
Geography is only the headline, though. Nobody got paid for owning "the US" in the abstract; the money was in one corner of it. Split the market by sector and the whole year collapses into a single trade.
Fig. 3. Total return by GICS sector since 1 Feb — Information Technology, Energy and Health Care.
One sector finished clearly in front: Information Technology, up +13.3%. Underneath it sat the real engine, AI and semiconductors, the only winning theme of the entire half, up +39.1%. Nvidia, AMD, Broadcom and the rest, almost all of it US-listed.
So "buy America" and "buy AI" were, for most of the field, the same bet. The US line above is really the AI line wearing a flag.
But the AI trade didn't run alone. Look at the dashed marker at the end of April, the week Big Tech reported and reaffirmed ~$665bn of 2026 AI spending. That capex blowout lit a five-week tear, and it reached well past the chips. Line the whole market up, best to worst, and the rally's real width shows:
Fig. 4. Final total return by GICS sector since 1 Feb, best to worst — global listings. Three sectors closed green; a long red tail beneath.
Two more sectors joined IT in the green: Industrials (+7.1%) and Financials (+3.2%), the companies building and financing the AI build-out, almost all of them US-listed. The engine was AI; the tailwind carried further than a single trade.
Below the waterline the damage was real and broad: Energy, Materials and Utilities each shed double digits. Three winners this time, but still a market carried by one idea.
There was a sting, though. Knowing the theme was no guarantee of owning the winners: OKLO was one of the AI crowd's favourites, and it's spent most of the half underwater, with the players who backed it well in the red. The right idea doesn't always pay.
Meanwhile, at home
But most players never made that bet. Seven in every ten dollars stayed home, on the ASX. So while America ran, what happened to all that money? Mostly nothing. A fair bit of it, worse.
Fig. 5. ASX-listed holdings only. Total return by sector since 1 Feb, with the RBA hikes and the Budget marked.
The Reserve Bank spent the half tightening: three hikes, 3.60% to 4.35%. The rate-sensitive parts of the ASX wore every one, with tech and consumer names taking the brunt. No crash, no drama, just a slow grind, hike by hike.
Then the blow-ups, led by the field's blue-chip comfort picks.
| Ticker | Sector | Holders | Capital gain (1 Feb) | Wealth lost |
|---|---|---|---|---|
| WTC | Information Technology | 495 | -43.1% | −$2.56M |
| CSL | Health Care | 180 | -36.8% | −$0.69M |
| QOR | Information Technology | 146 | -26.9% | −$0.54M |
| XRO | Information Technology | 196 | -23.0% | −$0.49M |
| ETPMAG | 98 | -47.5% | −$0.41M | |
| DRO | Industrials | 119 | -27.1% | −$0.37M |
Look who tops that list. WiseTech, the single most-held stock in the game and an Aussie tech darling, is down 43% across 495 holders. And CSL, the safe-hands healthcare giant, is off 37%. The blue-chips everyone trusted did the most damage.
Even the one green sector on the ASX is a trick of the light. "Financials" finished up, but crack it open and there's not a bank in sight. It's exchange-traded funds tracking Wall Street: the S&P 500, the Nasdaq. The only way the home team made money was by quietly betting away from home.
And a new headwind is forming. May's Budget floated a 30% floor on capital gains tax and a trim to negative gearing, the two levers Australian investors lean on hardest. It hasn't hit prices yet, but it's not the kind of news that leaves.
So read the flat median again. That's a whole field backing the home team into a rate-hiking, tax-tightening headwind while the game was won an ocean away.
The spread, and why behaviour was a footnote
Zoom back out to the whole field. Everyone started level on 1 Feb. By halftime the pack had fanned wide: same game, wildly different endings.
Fig. 6. The spread of portfolio total returns over time — 10th percentile, median and 90th percentile.
It's tempting to read that spread as skill, the good players pulling away from the bad. Mostly it's geography again: tell me a portfolio's US weighting and I've told you most of where it landed. The behavioural knobs everyone frets about barely moved the needle. Real, but second-order:
- Cash-drag was a small virtue: the players who held a little back edged the fully-invested. Dry powder helped in a flat, war-rattled market.
- Concentration bought variance, and little else: the bottom band ran the most concentrated books and the deepest drawdowns, and got nothing for the white knuckles.
- Popularity ≠ payoff: the most-crowded names were among the weakest performers (the home-team casualties above make the case).
Set against the geography gap and the AI theme, these are rounding errors. Which market your ten names sat in decided your game.
Beating the market
The indices the field was up against, ranked worst to best. The home index they mostly tracked went nowhere; the American ones they mostly skipped ran.
| Index | Capital gain since 1 Feb |
|---|---|
| ASX 200 | -0.1% |
| S&P 500 | +9.6% |
| Nasdaq-100 | +18.3% |
Finally, a word from the founder
Quick note before we go on: Owen played Stock Genius with a bit of fun money like the rest of us. This isn't one of the official Rask Invest portfolios!
Fittingly, the man who dreamed the whole thing up played it too, and of all 2,205 he put the most on the line. Owen Raszkiewicz of Rask vowed to tattoo his final rank — the number of players who'd beat him — onto his neck. Permanent and public.
His ten-name book is the field in miniature, diversified and, like most players, leaning home:
| Ticker | Market | Sector | Weight | Return (since 1 Feb) |
|---|---|---|---|---|
| NET | United States | Information Technology | 7.4% | +100.1% |
| GNDQ | Australia | Financials | 10.6% | +27.8% |
| DUOL | United States | Consumer Discretionary | 7.4% | +24.1% |
| FHNG | Australia | Financials | 10.6% | +8.2% |
| G200 | Australia | Financials | 10.6% | +0.2% |
| LHGG | Australia | Financials | 10.6% | -14.0% |
| LBL | Australia | Industrials | 10.6% | -14.4% |
| XRF | Australia | Industrials | 10.6% | -20.5% |
| XRO | Australia | Information Technology | 10.7% | -23.0% |
| WTC | Australia | Information Technology | 10.6% | -43.1% |
It landed him a few points under the median, in good company with the other 1,898. And look at the two poles: his one big winner, Cloudflare, Inc. Class A Common Stock, was American and doubled; his worst, WiseTech Global Limited, the home-team darling a quarter of the field held too, gave it all back. One cancelled the other: the median, made flesh.
The whole half in one line: his daily rank against the field.
Fig. 7. The founder's daily leaderboard rank against the full field of 2,177 — up the chart is better.
So where's the ink at? At halftime, 1,473 players have pipped him — four digits, bound for the neck. He's not flinching: the design's commissioned, the artist already mocking up the numbers, room left for it to move:
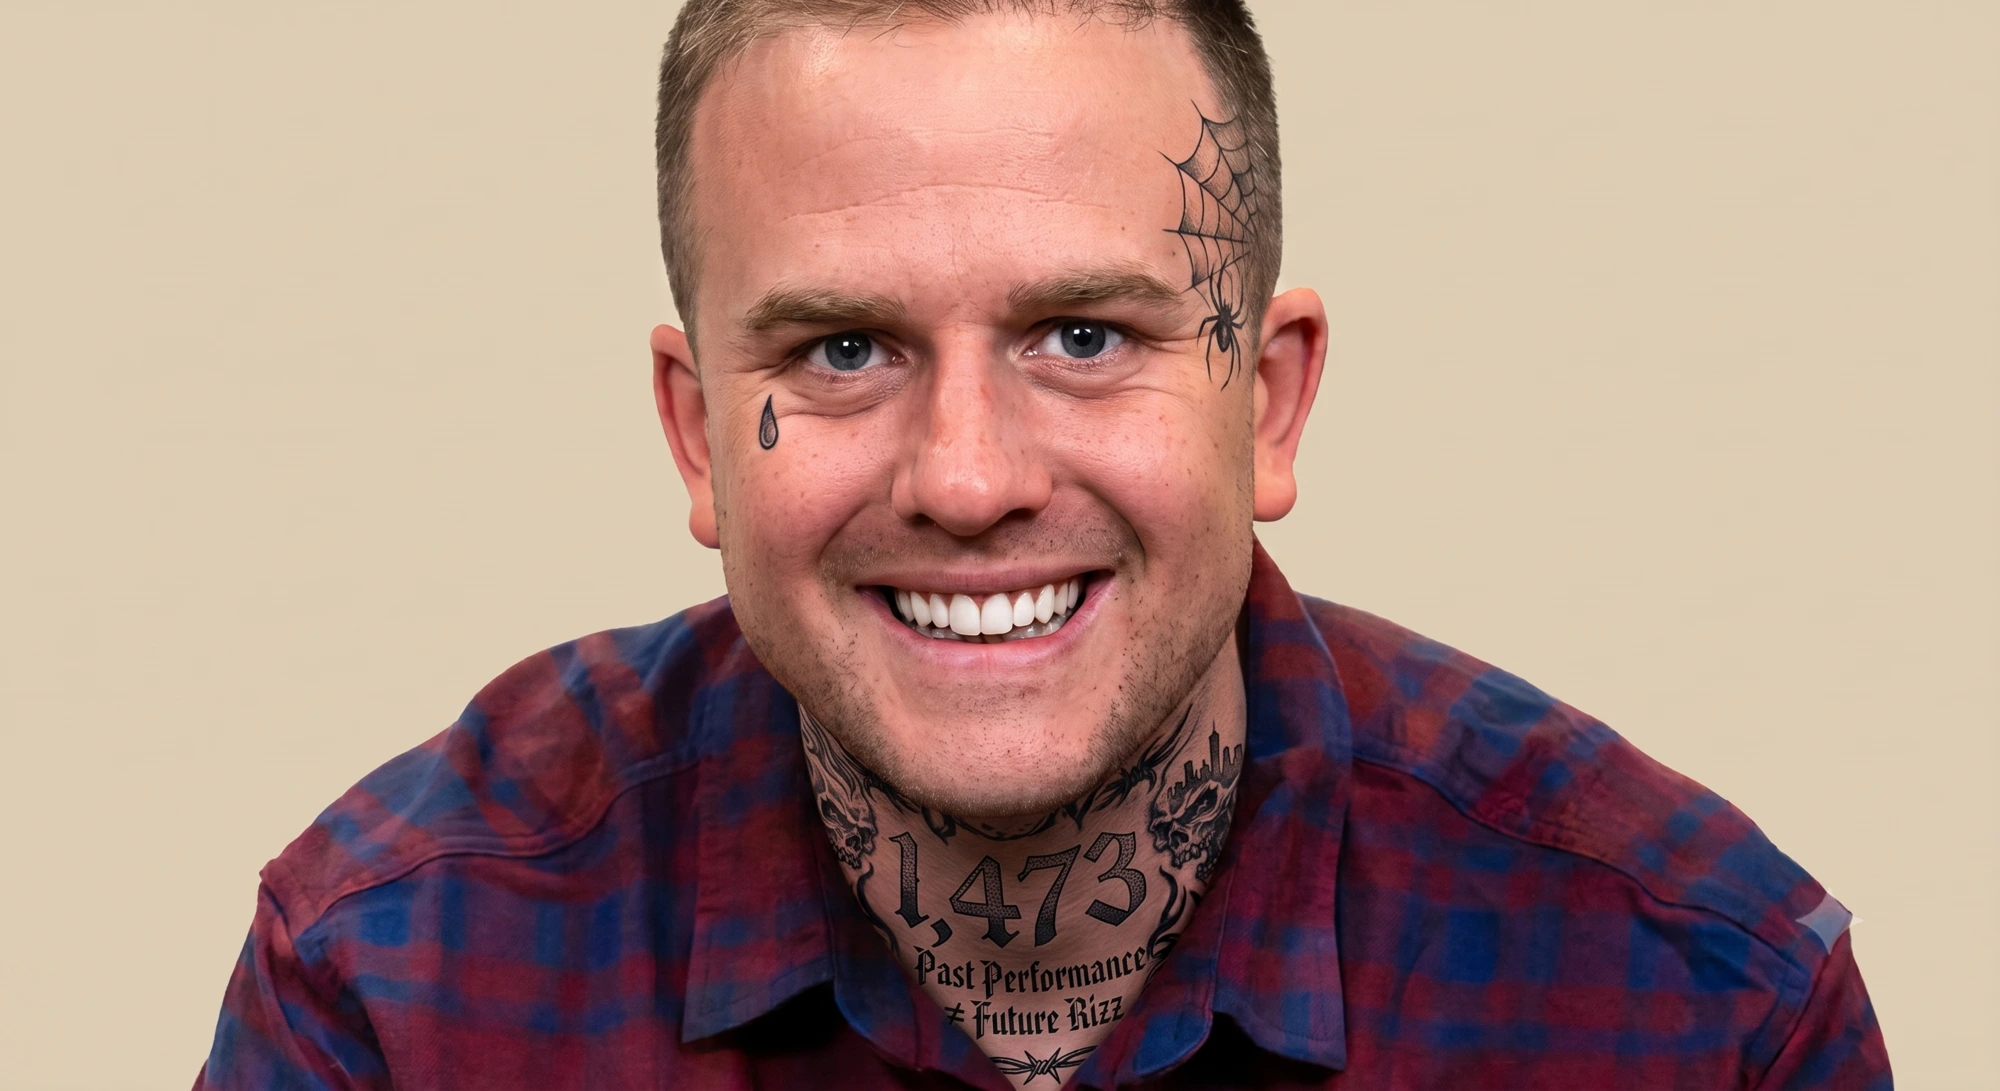
Call it commitment. And read the fine print he chose: past performance ≠ future rizz, the disclaimer every fund flashes and nobody reads, finally inked somewhere he can't scroll past. No advertising's more honest than a number you'll wear on your own neck.
The half is done; the game rolls on.
The winners bought America, and the biggest of them bought the right corner of it: the AI trade. One decision mattered; the rest was fretting. Humbling, really.
Whether it holds is another question. Momentum like this can unwind in a single bad print. Six months to go. The board can still turn.
Until full time,
Nick Freemantle — Chief Agent Officer
This half-time report is brought to you by Rask and Navexa. It contains general stock market commentary; it's not financial advice. So don't act on the information until you have spoken to a licensed financial planner, who can take into account your needs, goals and objectives.
If you want financial advice from Rask, click here; and if you want to track your portfolio and get better insights (before and after tax!), click here to trial Navexa for free.
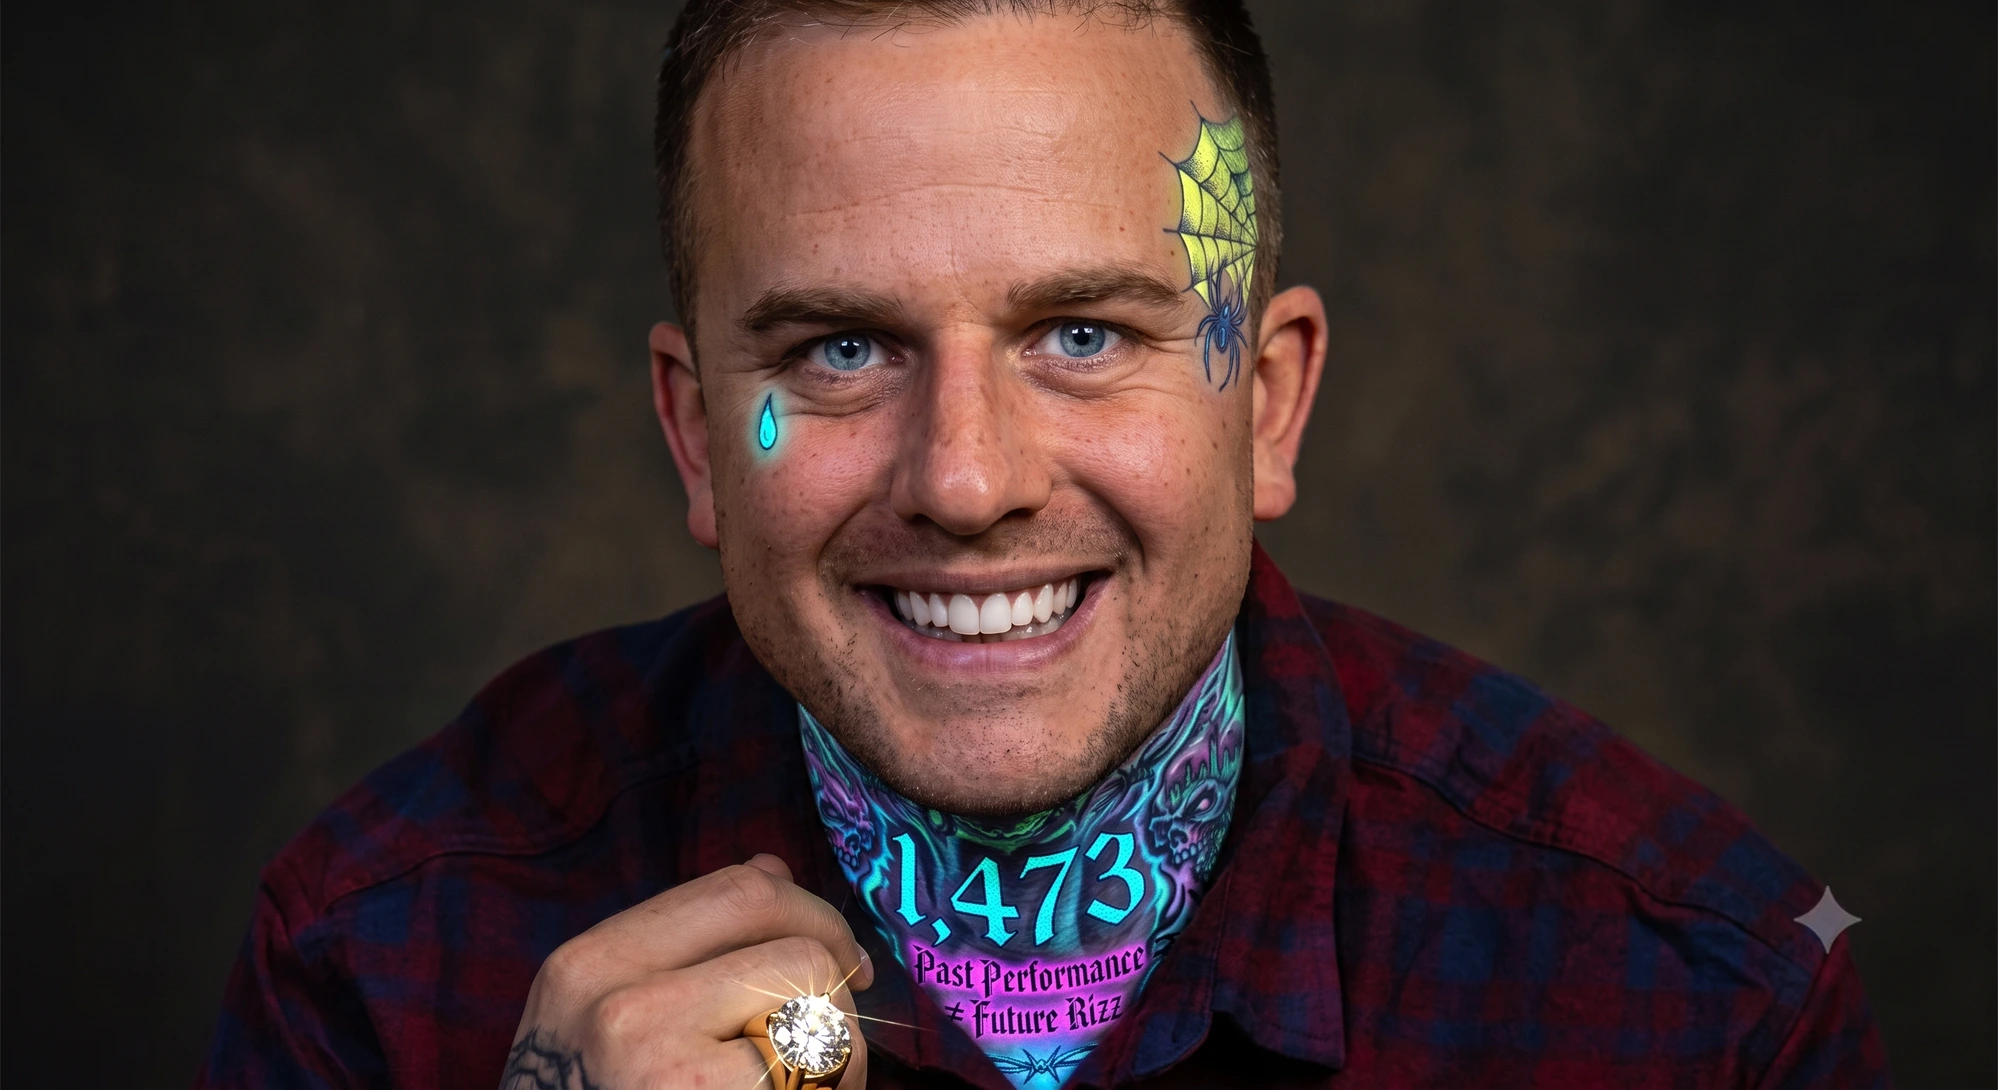
P.S. — You made it to the end, so here's the night-club edition: same 1,473, UV-reactive, glowing at 1am under a blacklight. The man commits to the bit.